
Google Analytics is the motherlode of web data measurement. Its numbers will tell you everything and more about what your site is doing, so you can move forward with your marketing.
The goal is to turn data into information, and information into insight.
-Carly Fiorina, Former CEO of HP and current Presidential candidate
The trouble is, the depth of Google Analytics’ reporting is so vast and encompassing, it’s easy get lost among the numbers and crawl out feeling bewildered and betwixt. But that’s no reason to be daunted.
I can’t tell you everything about Google Analytics in one post, but it would be professionally irresponsible to ignore this valuable tool in a series called Advanced Techniques for WordPress.
What I will show you is how to get started with Google Analytics and how to learn more.
Why Google Analytics?
Unlike any other form of publishing or advertising, online marketing has the unique ability to report in detail everything we want to know about how, what and where our digital content is consumed.
That information tells us what we’re doing right and wrong so we can improve our marketing.
Without big data analytics, companies are blind and deaf, wandering out onto the Web like deer on a freeway.
– Geoffrey Moore, Author of Crossing the Chasm & Inside the Tornado
Basically, you just have to have Google Analytics.
Open an account
To configure and access Google Analytics for your site you must be the site’s administrator and have permissions to place code there.
After logging into your Google account, go to Google Analytics Home. Click Access Google Analytics or Sign Up.
On the New Account page you’ll enter an account name, website name and URL, industry category and reporting time zone. By default, Google will offer products and services, benchmarking, technical support, and account specialists.
Click Get Tracking ID and accept the terms.
Tracking Code
The next page presents your Tracking Code which appears like this:
<script>
(function(i,s,o,g,r,a,m){i[‘GoogleAnalyticsObject’]=r;i[r]=i[r]||function(){ (i[r].q=i[r].q||[]).push(arguments)},i[r].l=1*new Date();a=s.createElement(o), m=s.getElementsByTagName(o)[0];a.async=1;a.src=g;m.parentNode.insertBefore(a,m) })(window,document,’script’,’//www.google-analytics.com/analytics.js’,’ga’);
ga(‘create’, ‘UA-62413801-1’, ‘auto’);
ga(‘send’, ‘pageview’);
</script>
You’ll also receive a Tracking ID which appears like this: UA-62413801–1
Place Tracking code in Header.php
Google says that you must place the tracking code on each page of your site that you want tracked.
But with WordPress, since your header appears on every page, the code only needs to be pasted in the header section of your site, somewhere before </head> on header.php, which you’ll find in Appearance>Editor.
Place UA Code in Google Analytics by Yoast
The other way to set your site up is using Google Analytics by Yoast plugin. Once activated, go to the GA Settings page and enter your UA Code. Save Changes.
Click authenticate with your Google Account and a box will pop up to choose your Google Account and then accept Yoast viewing of your data. Google will give you an authentication code to paste into a box – and Save.
User ID
You have the option of incorporating the User ID with your Tracking Code to get a more holistic view of your users.
When you implement the User ID, you can identify related actions and devices and connect these seemingly independent data points. – Google
Verify with Webmaster Tools
Since it’s too early to see data appear under Reporting, now is a good time to verify your site at Webmaster Tools.
Related : How to Use Webmaster Tools and Make Google your Friend
Getting around Google Analytics
The Google Analytics site navigation has improved a lot over the years.
Home displays all the sites you manage and by dropping down the files you’ll see in a glance the Sessions, Avg. Session Duration, Bounce Rate, and Goal Conversion Rate
Reporting contains a multitude of views of your site accessed through the left-side navigation with headings such as Dashboards, Shortcuts, Intelligence Events, Real-Time, Audience, Acquisition, Behaviour, and Conversions. More on that soon.
Customization displays customized reports you’ve created.
Admin is the drivers seat of Google Analytics, offering tools and views of all your settings.
Setting up
While waiting for enough time pass to accumulate enough traffic metrics to measure, you can finish setting up your Google Analytics account. This involves setting up Goals, Filters, Site Search, Webmaster Tools, and Dashboards
To do so, read the excellent post, How to Setup Google Analytics: 5 Quick Videos That Make it Easy from Orbit Media, and use it as your guide.
Reading reports
For most people, reading charts and graphs and lists of numbers is tantamount to drinking quinine, and can leave your mind in a swirl of timelines and tables, percentages and ranges.
But you have to read your GA reports. Not once in a while, but regularly. Otherwise, you’ll forget your way around the dashboard and your sense of the metrics won’t stick.
To help cut through the morass, Google Analytics allows you to make Shortcuts to your favorite reports in order to easily navigate to what you’re following. Just click Shortcuts on the report page.
Or, click Add to Dashboard on your favorite reports, and that report will go to your dashboard for easier viewing.
If you have multiple “properties” in the account, you can switch between them from within a report. That way you can compare reports between sites.
There are dozens of possible reports to read, but I’ll tell you about my favourites.
My Favorite reports
Dashboard>Private>My Dashboard
By default, this displays: Visits with Search, New Visits, Visits by geo, Visits by Browser, Unique Search, Bounce Rate, Revenue, Average Visit Duration and Pages per Visit, and Goal Completions. You can add widgets (mentioned above) to create a customized array of metrics.
Audience>Demographics
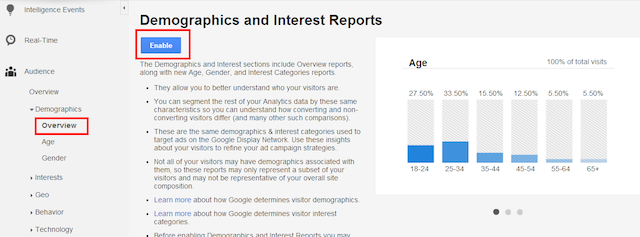
Shows the age, gender and interests of your viewers, which comes in handy when you’re writing posts.
Audience> Geo
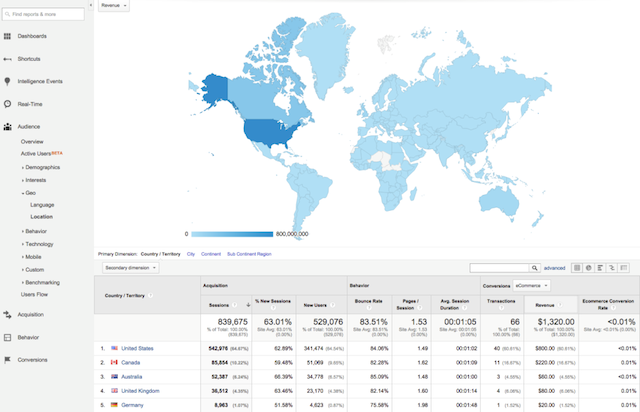
Shows the language breakdown as well as world map of your readers to expand your worldview for blogging.
Audience>Mobile>Devices
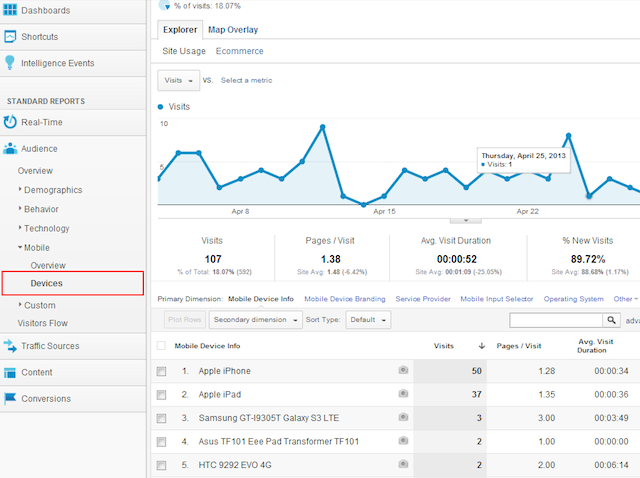
Super relevant now that Google has made mobile responsiveness a criteria for ranking. Seeing which devices are being used most can help you make design decisions.
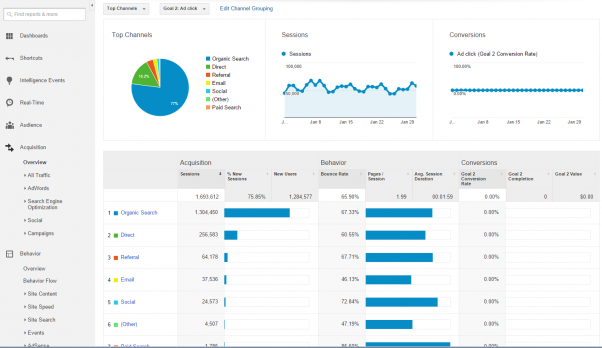
Acquisition Overview
Shows a dashboard showing where your traffic and conversions (sales/signups) are coming from: Organic Search, Direct, Social, Referral, Email and Other. Good for strategizing marketing and promotions.
Behavior> Site Content> All Pages
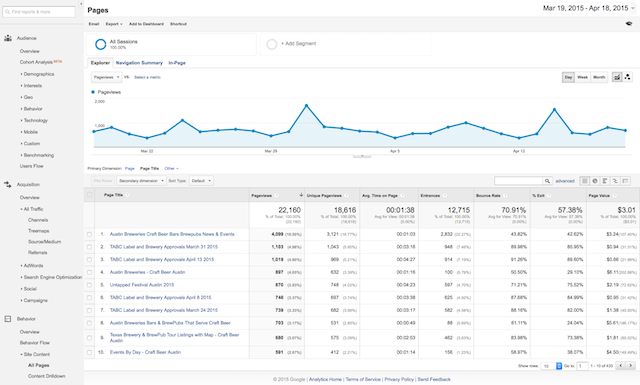
You’ll see the Page Views, the average time spent on that page, Entrances and % Exit as well as Page Value.
Behavior> Site Speed> Speed Suggestions
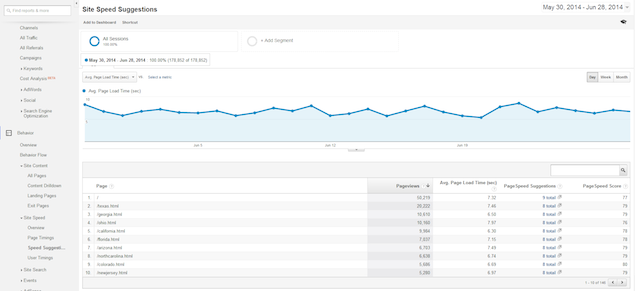
Here’s where you can see the average load times for your top pages as well as suggestions for improving them. Clicking the number of suggestions takes you to Google Developers PagesSpeed Insights and a suggestions summary of what you should consider fixing.
Behavior>Flow
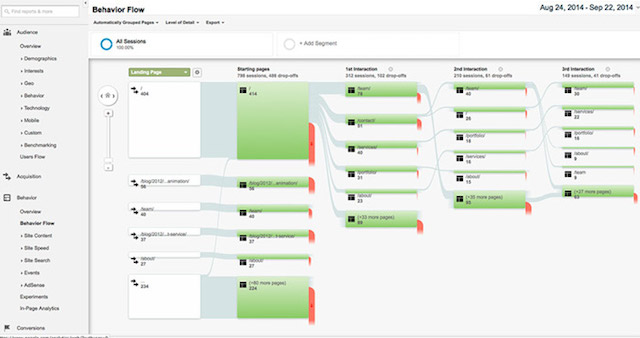
Presents a graphic of how traffic flows from the Landing Page to subsequent pages.
Conversions>Goals
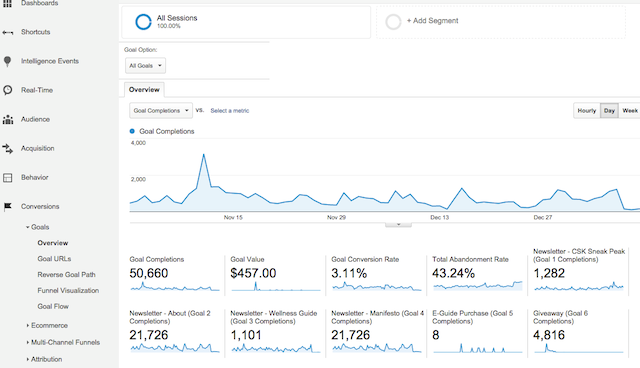
A view of how many sales or signups are made, by page.
Google Analytics glossary
Average Time on Page – An average of the amount of time page visitors spend on that particular page
Acquisition – How visitors arrive at your site is important for determining where to put your marketing energy
Behavior – Seeing how visitors interact with your site provides a guide to optimization
Bounce rate – For all sessions that start with the page, Bounce Rate is the percentage that were the only one of the session.
Exit % – For all pageviews to the page, Exit Rate is the percentage that were the last in the session
Pageview – An instance of an Internet user visiting a particular page on a website.
Sessions / Visits – The period of time a user is active on your site or app. By default, if a user is inactive for 30 minutes or more, any future activity is attributed to a new session. Users that leave your site and return within 30 minutes are counted as part of the original session.
Unique Page Views – Unique page views refers to the number of individual visitors to your pages as a subset of your total page views.
Users / Visitors – The unique browsers that visit your website or mobile app.
More to learn
As I said, this post is merely an introduction to Google Analytics. The tool is so deep and so vast that it takes so study and practice to master, one little post is just a blip on your dashboard.
If becoming a Google master is something that interests you, here are places to learn more:
Google – Analytics Training & Certification. Study for free on the mothership of web search.
Lynda.com – Google Analytics Tutorials & Training. A series from one of the best online training courses
And there are numerous blogs related to analytics, starting with the mothership itself:
Google Analytics Blog
Crazy Egg
Optimize Smart
Kissmetrics
Occam’s Razor
Online Behavior
Search Engine Watch
Measurements Matter
Once you have Google Analytics measuring your website’s traffic, the secrets of the Internet are yours.
Have fun with your Google Analytics account!