
Page speed is nothing like it used to be. Time was, you could go to the kitchen for a cup of tea while waiting for a Web page to load, and the pages were just basic HTML.
Now, Web pages are super sophisticated and weighty, and the Internet tubes have expanded to carry the load – and fast. Web surfers now expect everything now and according to experts, people won’t wait more than four seconds for screen satisfaction.
Plus, Google now takes page speed into consideration when it doles out page ranks. All relevance being the same, the fastest sites are rising to the top of the SERPs.
Do you know how long your web pages take to load? Do you see a high bounce rate in your Google Analytics? And, Is your traffic lower than you expect?
You might have a need for page speed.
Lately, I have been consumed with the page speed of my sites. And after a million tests and pads full of notes, I’ve finally got this site down to an under-3 second load time. But it wasn’t easy to shed that extra 5-8 seconds. Here’s how I did it.
Page Speed Tools
To speed up your site, you have to know where and why it’s slowing down. A number of free tools are available to not only measure the speed of your site, but also give tips on how to remedy the slowness. Here are a few tools I like.
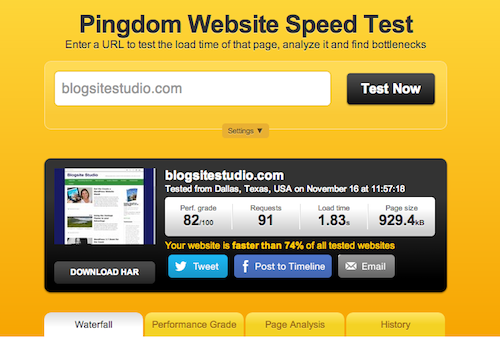
Pingdom
I like Pingdom best, and not entirely for aesthetic reasons. While it does look more like a game than a test, it’s pretty serious. It tests your site from servers in North America and Europe, so the results are never the same.
 The results are presented in a pretty “Waterfall” graphic that sorts by load order. You can easily pick out the files that take the longest to load. Clicking on the waterfall bars lets you see what part of each files loading is taking the longest. In the case of my custom-css file, the wait time is longer than the connect time.
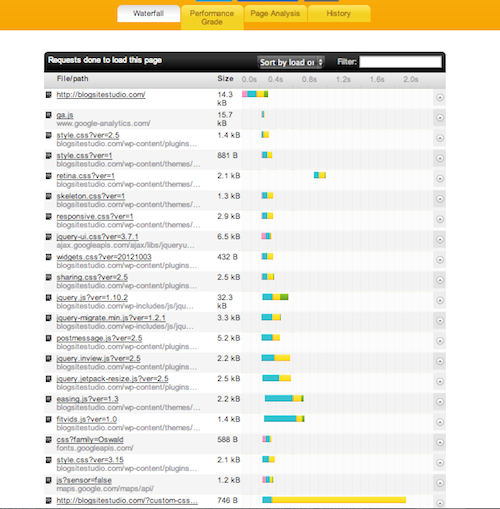
On Pingdom I was able to see which plugins were slowing things down the most. After I deleted plugins that had long Waterfall strings, I immediately saw the results.
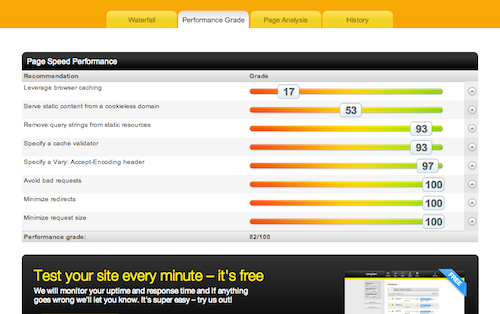
Clicking on Performance Grade gives you a list of fixes in order of importance based on a 1-100 score with color coding. My problem always seems to be leveraging server cache.
Page Analysis offers more detailed stats, much of which may make your head hurt.
History gives you a record of your tests results so you can see how far you’ve come. Click on the date and see the details. I can see that back when this site took 8 seconds to load, it had a plugin called Opt-in for Download that took 5-6 seconds of wait time.
Pingdom also has a handy function to email the test results using headers like, “Hi there, oh high and mighty being of the the Interwebs,” to alert your webmaster of the site’s slowness.
PageSpeed Insights
Naturally, one looks to Google for the last word on everything, since it is the gatekeeper of all things Internet. In Google Developers there are a number of helpful tools to optimize sites.
PageSpeed Insights will analyze the content of your page and and generate results for both mobile and desktop. It measures load time both for above-the-fold as well as full-page load. The scores range from 0-100 with 85 and above being the sweet spot for performance.
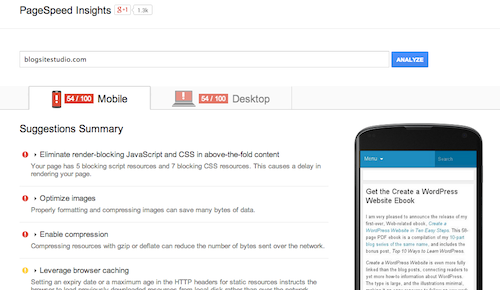
The fix suggestions are rated with red exclamations for top importance, yellow exclamations for moderate importance and green check for a good job.
The top suggestions for fixes are Optimize images and Eliminate render-blocking JavaScript and CSS above the fold.
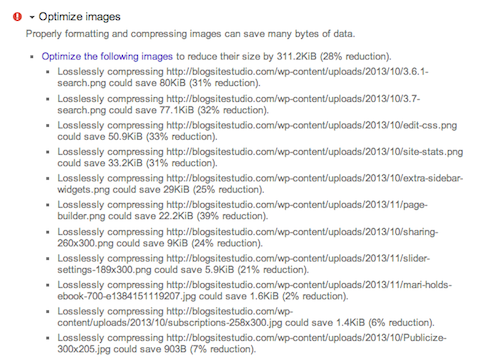
From the Optimize image drop down list I can see that the types of images most in need of compression are .png files. The proposed reduction for those are in the double digits, compared with only single digit reductions for .jpg. Interesting.
What’s great about Google PageSpeed Insights is its links to information pages that explaining what “Remover render-blocking JavaScript” means.
GTMetrix YSlow
GTMetrix provides numbers from Google PageSpeed and Yahoo! for its results. It’s got a clean look and ranks PageSpeed and YSlow separately as percentages and, just to make you feel young again, a school grade from A-F.
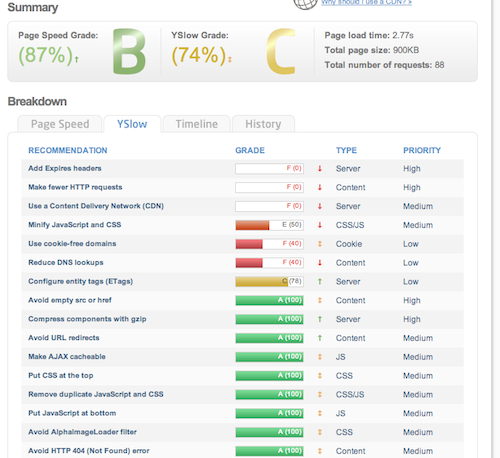
The analysis breaks down between PageSpeed and Yslow, plus a Timeline waterfall and History. GTMetrix History is not nearly as nice to read as Pingdom’s.
What I found interesting was the difference in results between PageSpeed and Yslow, viewable with the click of a tab. PageSpeed proves much kinder and you tend to wonder if they are looking at entirely different pages.
Page Speed Fixes
What I found worked the best to bring my scores up is deleting plugins. Not just deactivating, but purging the code from your installation. Strip away the fat and keep what you absolutely need.
I did install gzip compression in my .htaccess file and that seemed to help. Here’s an amusing video about gzip:
Moreover, I will stop using png files.
More work to do…
Speed it up!
Improving your page speed is the best way to improve your users experience and make Google love you. It will also make you think twice about uploading big files and unnesessary accoutrements to your site.
If you are confused about what the fixes are, Google them. Remember: if it’s about the Internet, it’s on the Internet.
I encourage – nay, challenge – my readers to do some page speed testing, make changes and make notes of your improvements. Play with it, have fun. And please, tell me all about it.
Thanks and welcome to new bloggers who subscribed to Blogsite Studio recently and received my new ebook, Create a WordPress Website. I hope you’re enjoying it and please, recommend it to your friends.